

JIRAM (Jovian InfraRed Auroral Mapper) is an Italian instrument on board NASA's Juno spacecraft, in polar orbit around Jupiter. It combines in a single instrument a camera and a spectrometer that observe the infrared between 2 and 5 µm and share the same telescope. Juno spins at about 2 revolutions per minute, so JIRAM uses a moving mirror that compensates for the rotation and keeps the observed scene still. It is designed to withstand Jupiter's intense radiation, with a mass of 12.9 kg and an average power consumption of about 16 W. The instrument is funded by the Italian Space Agency (ASI) and was built by Selex ES (now Leonardo). INAF-IAPS in Rome holds the scientific responsibility.
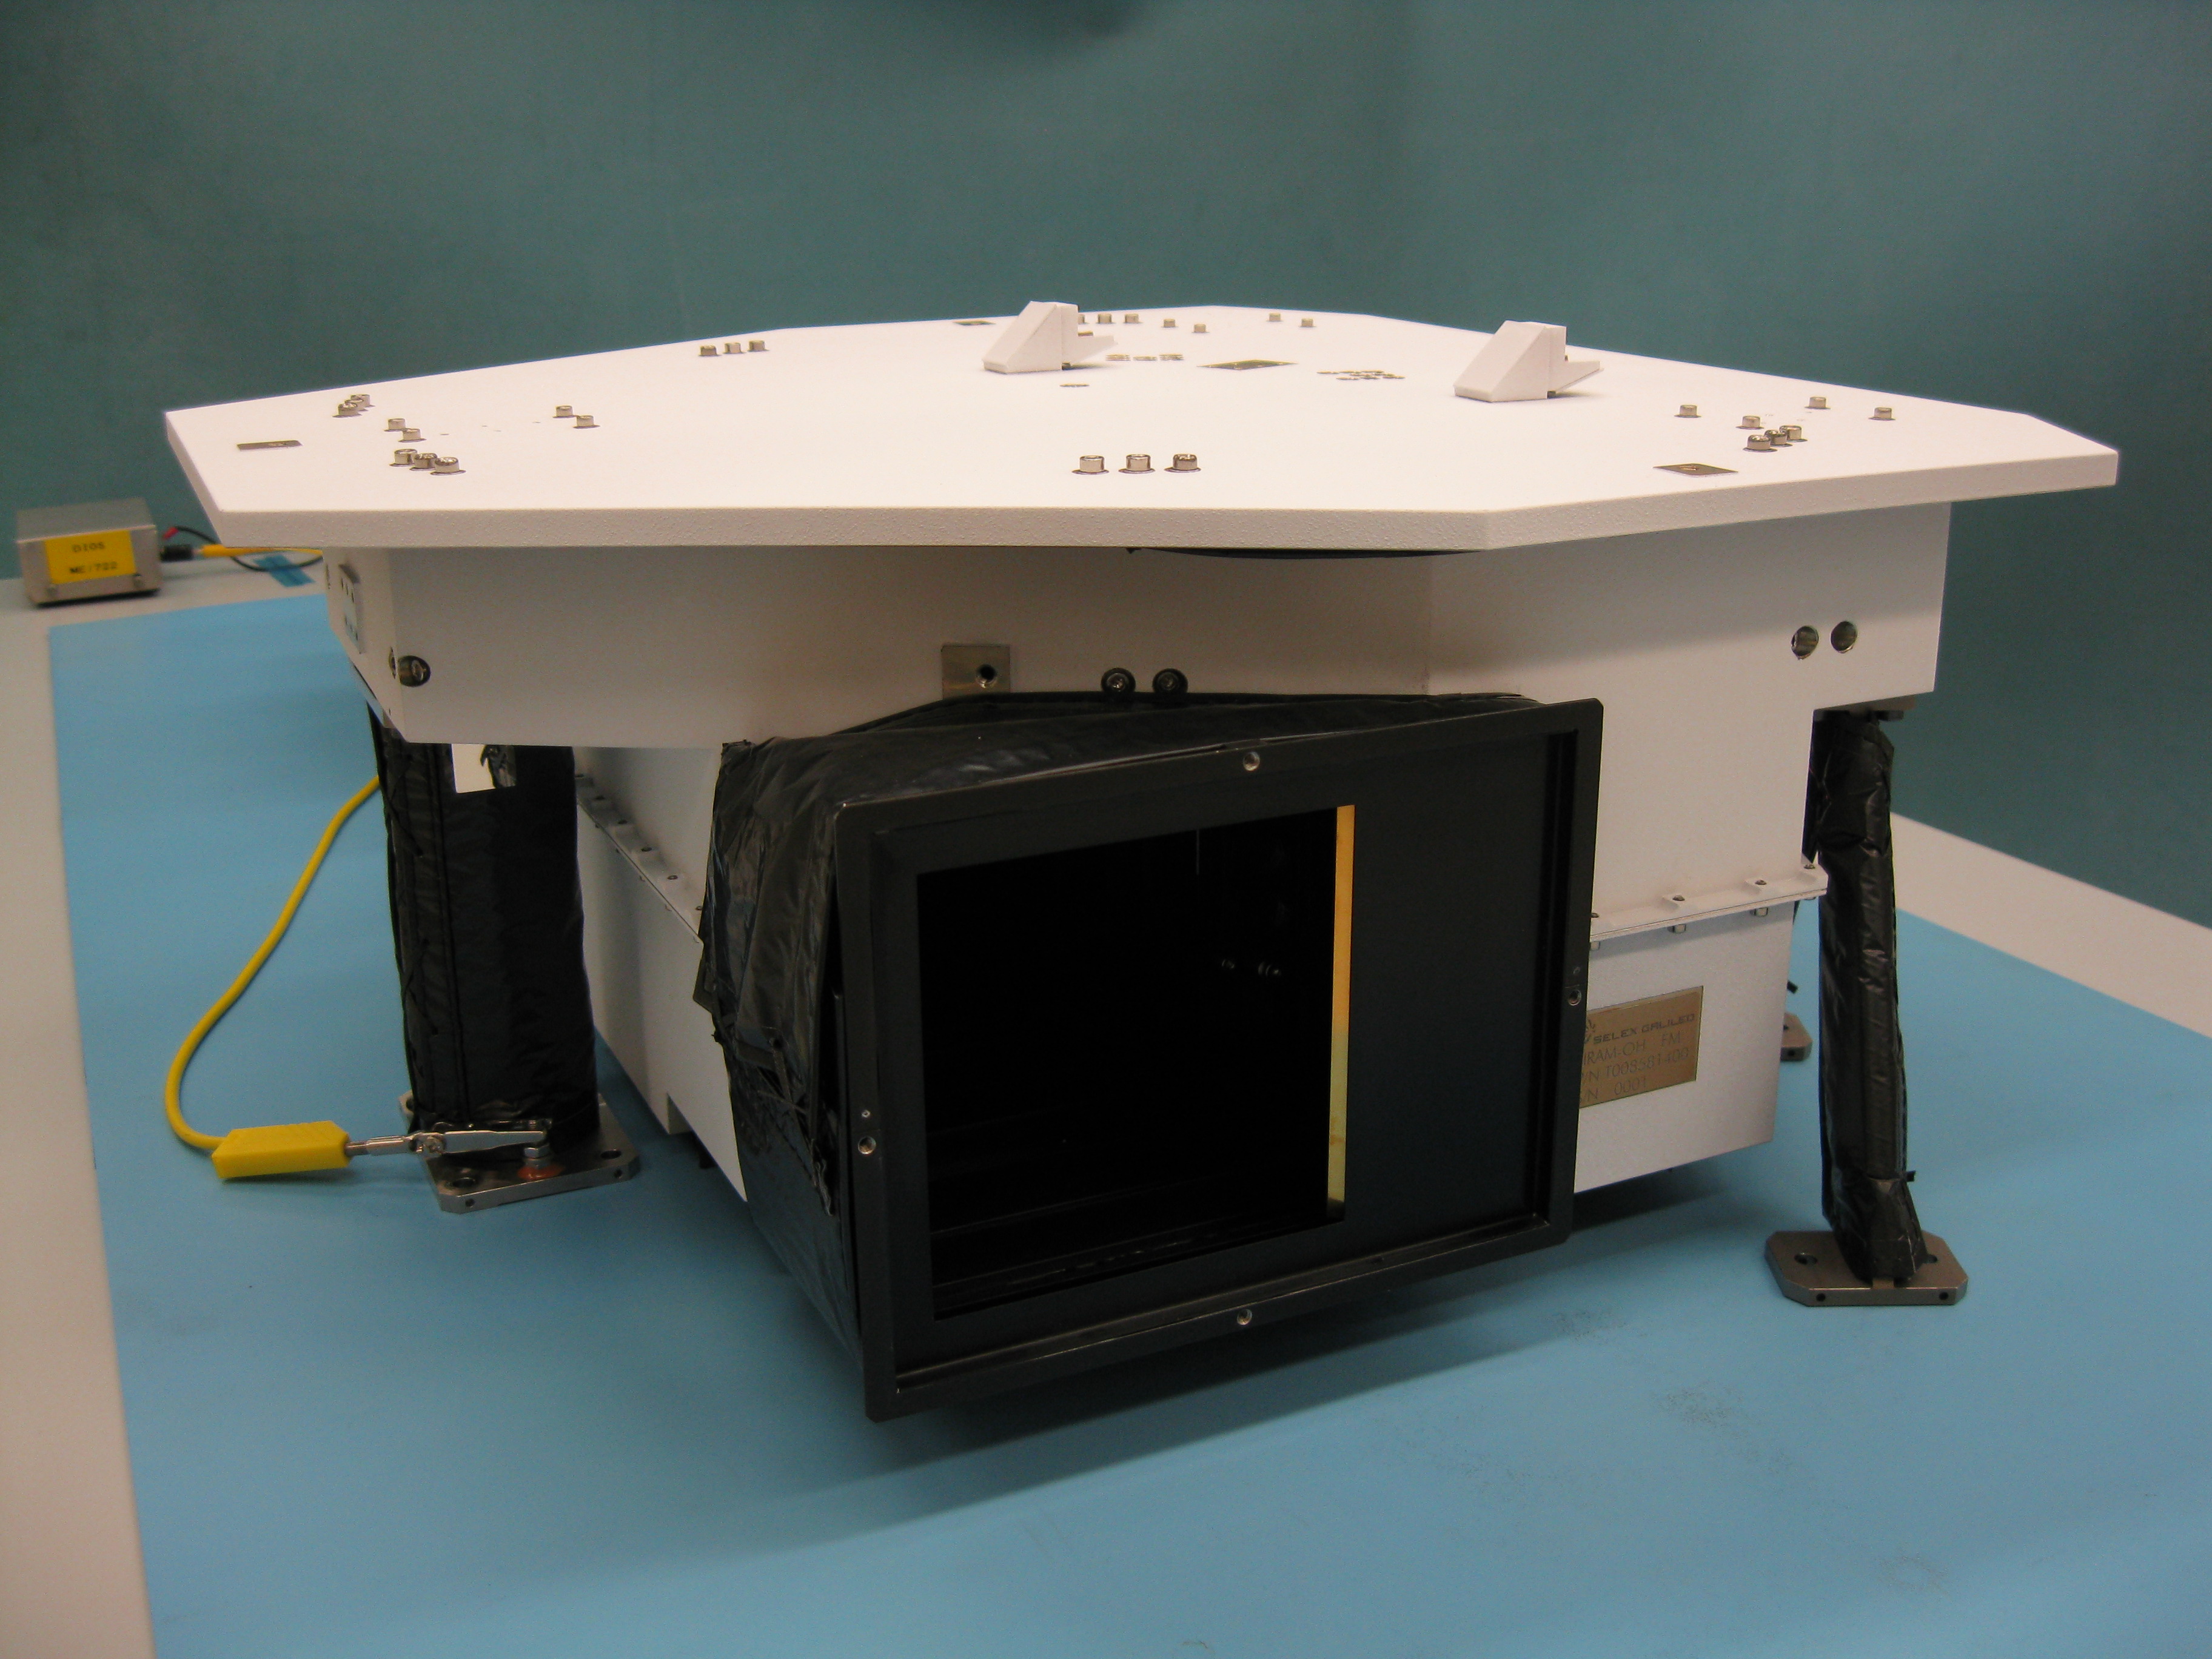 JIRAM optical head
Heritage
JIRAM builds on Italian experience with imaging spectrometers for planetary exploration: VIMS on Cassini, VIRTIS on Rosetta and Venus Express, and VIR on Dawn. The project was started by Prof. Angioletta Coradini, a leading figure in Italian planetary science. Unlike its predecessors, JIRAM is the first instrument of this family designed for a spinning spacecraft.
Scientific objectives
-
Jupiter's aurorae. Jupiter's aurorae are the most powerful in the Solar System. JIRAM studies their infrared emission from the H₃⁺ ion and reconstructs their shape, intensity and evolution over time, including the "footprints" left by the Galilean moons.
-
Atmosphere. Through hot spots, regions almost free of clouds, JIRAM probes the deep layers of the atmosphere. It studies clouds, storms and convection and measures gases such as water, ammonia and phosphine.
-
Origin of the planet. The chemical composition of the atmosphere preserves traces of how and where Jupiter formed. It therefore helps reconstruct the earliest stages of the history of the Solar System.
International collaborations
JIRAM is Italy's contribution to Juno, a mission of NASA's New Frontiers program. The science team includes INAF-IAPS, CNR-ISAC and ASI for Italy, and Cornell University and the Jet Propulsion Laboratory (JPL/Caltech) for the United States. The JIRAM operations centre in Rome works with the Juno Science Operations Center at the Southwest Research Institute (San Antonio, Texas) and with JPL (Pasadena). The data are made public through NASA's Planetary Data System.
Team
PI: Alessandro Mura
Former PIs: Angioletta Coradini, Alberto Adriani
PM: Roberto Sordini
AM: Monia Rossi
Team: Livio Agostini, Francesca Altieri, Francesco Biagiotti, Chiara Castagnoli, Mauro Ciarniello, Andrea Cicchetti, Emiliano D’Aversa, Davide Grassi, Gianrico Filacchione, Alessandra Migliorini, Alessandro Moirano, Maria Luisa Moriconi, Raffaella Noschese, Fabrizio Oliva, Elenia Pacetti,Enzo Papandrea, Christina Plainaki, Matteo Paris, Pietro Scarica, Giuseppe Sindoini, Stefania Stefani, Federico Tosi, Diego Turrini, Francesca Vitali, Massimo Zambelli, Francesca Zambon
JIRAM's main results
The discovery of Jupiter's circumpolar cyclones
Juno is the first spacecraft to fly directly over Jupiter's poles, and in 2017 JIRAM imaged its polar regions in the infrared. It discovered a structure never seen on any other planet: clusters of large cyclones arranged in polygons around each pole. At the north pole, eight cyclones surround a central polar cyclone. At the south pole, there are five circumpolar cyclones. Each one is 4,000–4,600 km across.
Observations in the following years showed that these formations are very stable: a change within a year is extremely unlikely. The cyclones also oscillate in sync, which points to atmospheric processes deeper than models predicted.
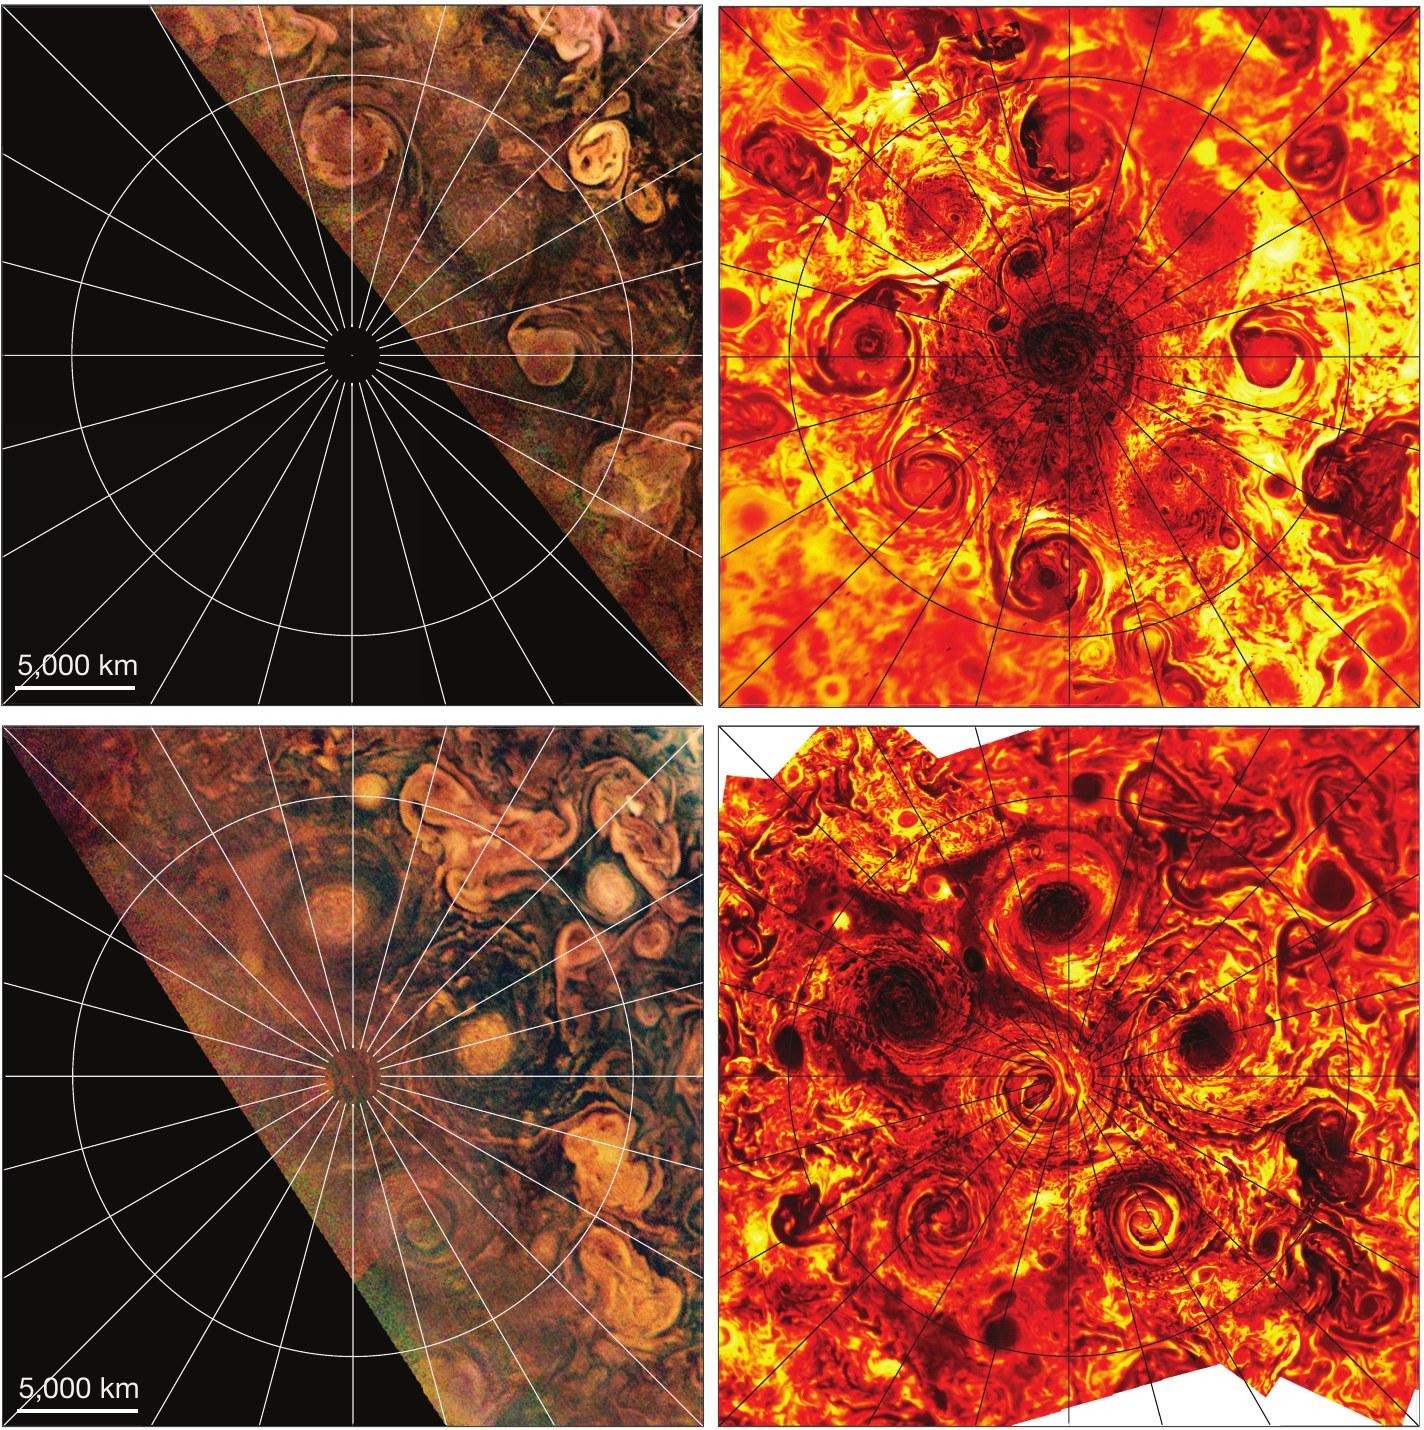
Figure 1. Jupiter's polar regions seen by JunoCam in visible light (left) and by JIRAM at 5 µm (right) during perijove PJ4 (2 February 2017). Top: the north pole, with eight cyclones around the polar cyclone; bottom: the south pole, with five cyclones.
Source: Adriani, A. et al. (2018), Nature 555, 216–219, Fig. 1. doi:10.1038/nature25491
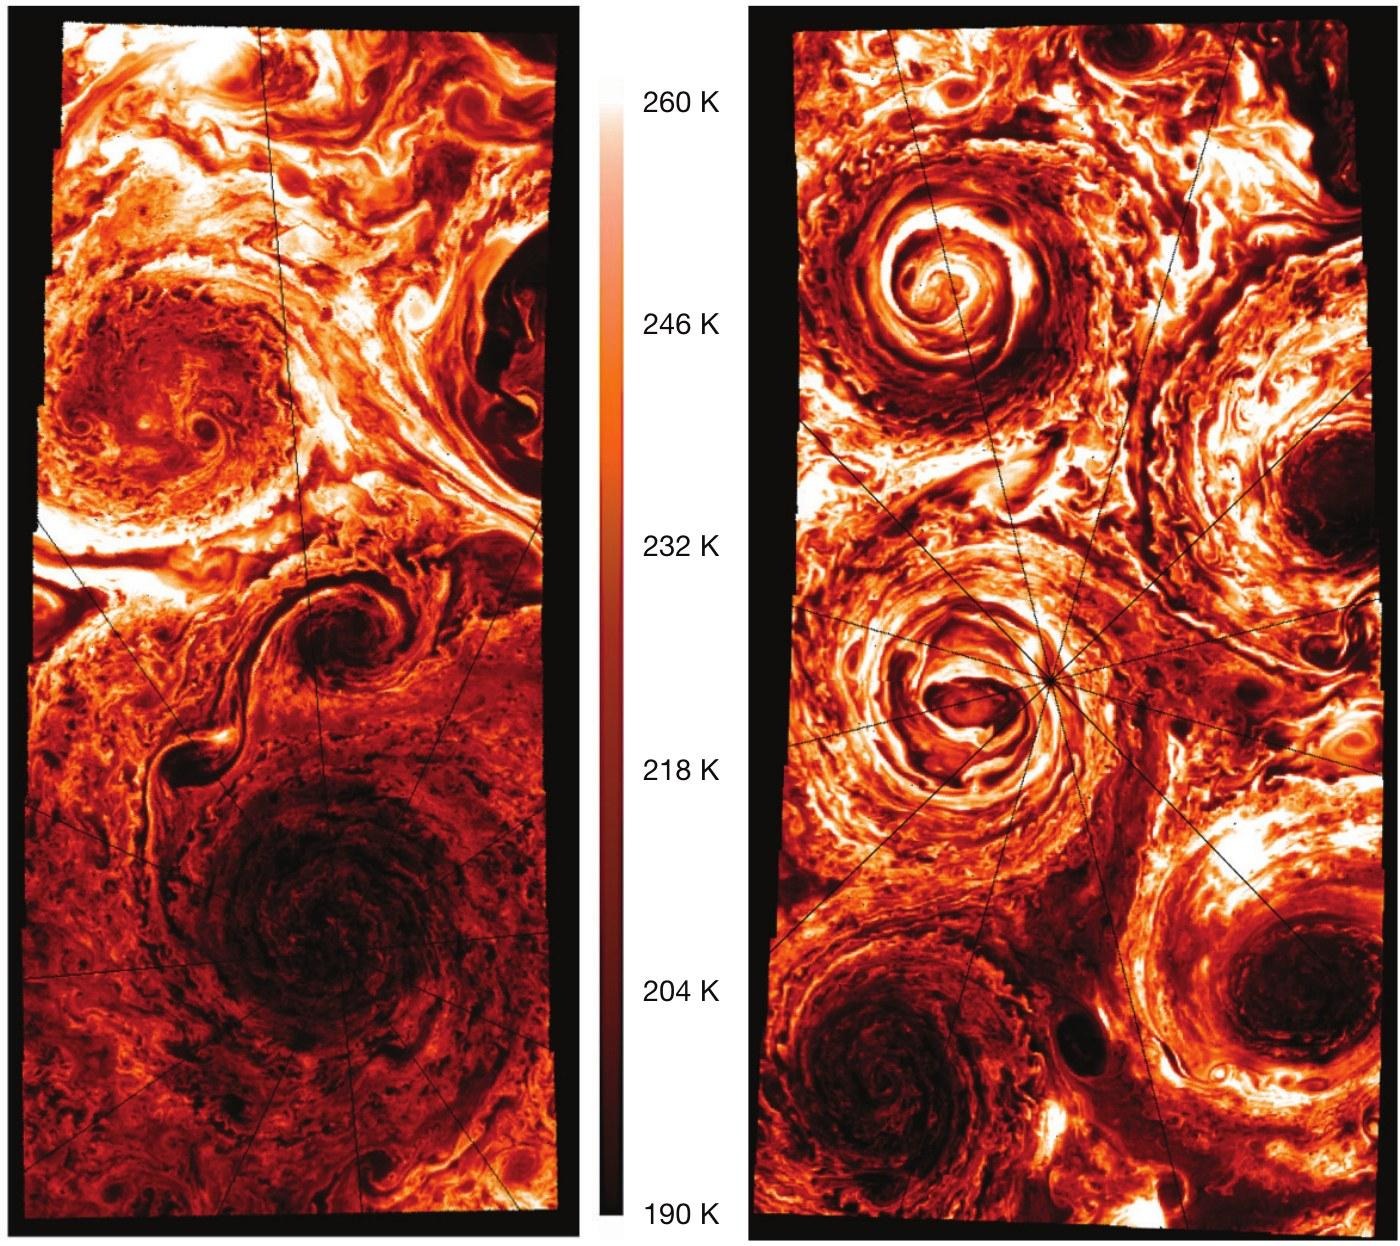
Figure 2. The highest-resolution JIRAM 5-µm maps obtained during PJ4: about 18 km/pixel for the north pole (left) and about 25 km/pixel for the south pole (right). The colour scale shows brightness temperature, between 190 and 260 K.
Source: Adriani, A. et al. (2018), Nature 555, 216–219, Fig. 3. doi:10.1038/nature25491
Jupiter's aurorae and the moons' "footprints"
The Galilean moons interact with Jupiter's magnetic field and leave bright "footprints" in the aurora. JIRAM observed them at a resolution of about 20 km, the best ever achieved.
Io's footprint has a swirling structure resembling a "von Kármán vortex street", and its tail splits in two. Ganymede's footprint also appears double, with a main spot preceded by a fainter one. This could offer a way to measure the moon's magnetosphere remotely. Overall, the interaction between Jupiter and its moons turns out to be more complex than expected.
Later studies described the shape of the auroral tails of Io, Europa and Ganymede. They then used the position of Io's footprint to derive the density and temperature of the Io plasma torus, the cloud of plasma fed by the moon's volcanoes, and to track its changes over time.
JIRAM also observed H₃⁺ emission far from the aurorae, at the planet's limb between 60° north and 60° south. For the first time it was possible to reconstruct how H₃⁺ is distributed with altitude at different latitudes. Its density decreases from 300 to 650 km altitude and is higher in the southern hemisphere. Temperature, instead, increases with altitude, from about 400 K to over 900 K.
Reference: Migliorini, A. et al. (2019), Icarus 329, 132–139. doi:10.1016/j.icarus.2019.04.003
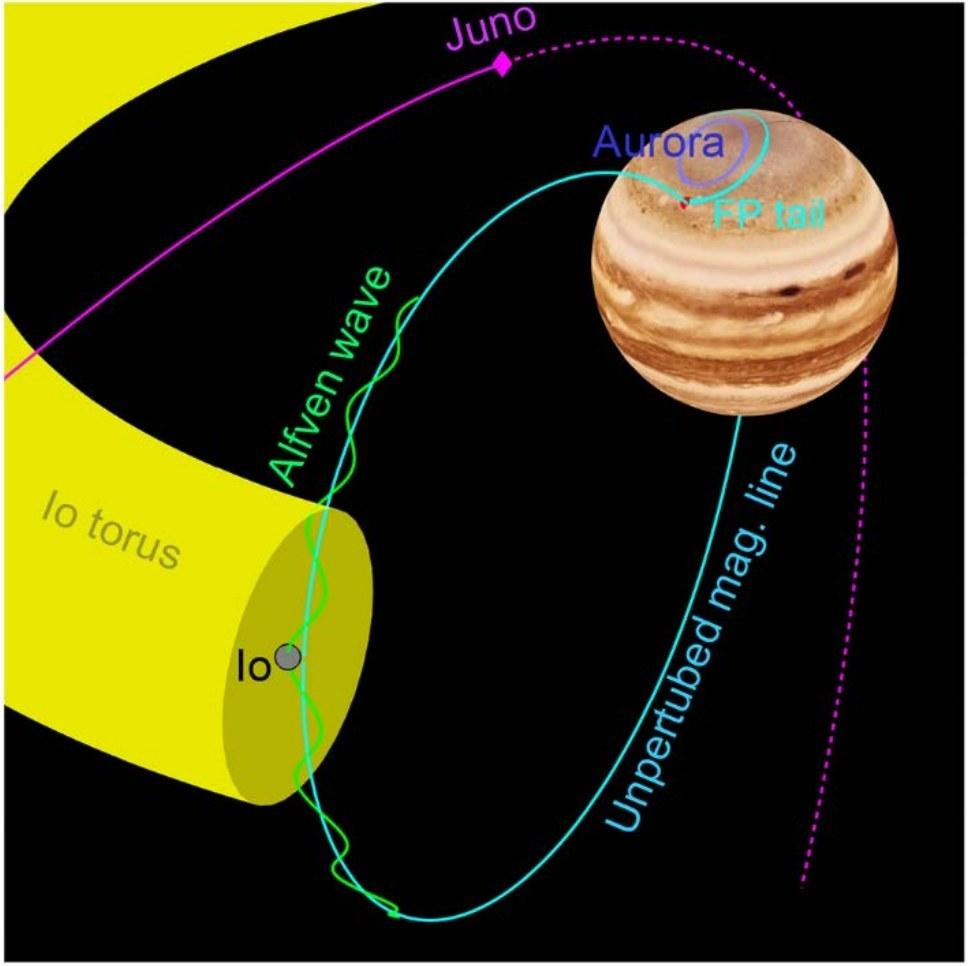
Figure 3. Diagram of the interaction between Io and Jupiter's magnetosphere, showing the Io plasma torus, the Alfvén wave, the magnetic field line, Io's footprint with its tail, and Juno's trajectory.
Source: Mura, A. et al. (2018), Science 361, 774–777, Fig. 1. doi:10.1126/science.aat1450
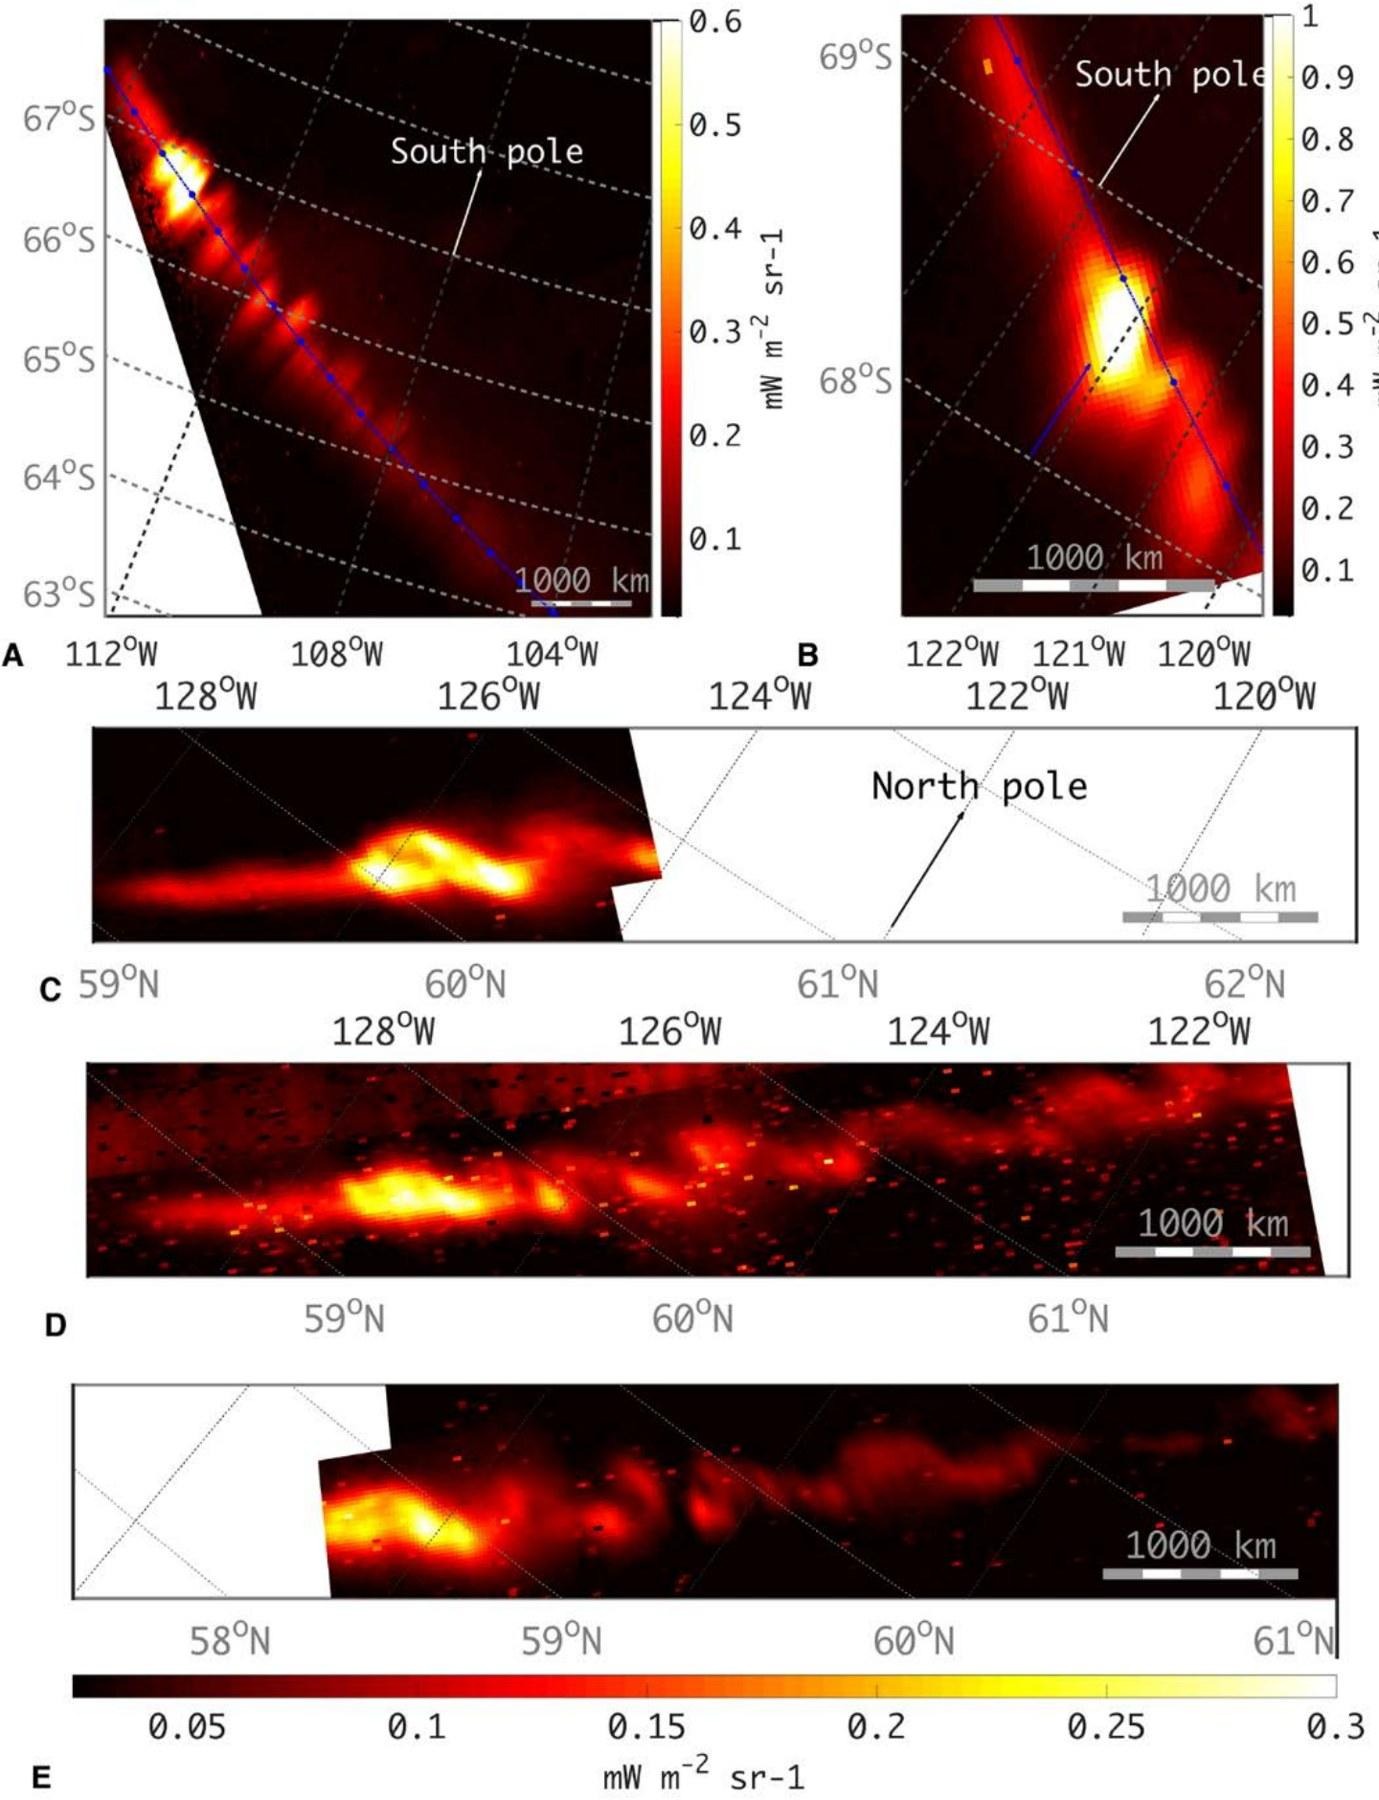
Figure 4. Io's footprint observed by JIRAM on 1 September 2017 in the southern aurora (A, B) and northern aurora (C–E). The main spot is followed by a series of regularly spaced secondary spots arranged in a swirling pattern, like a "von Kármán vortex street".
Source: Mura, A. et al. (2018), Science 361, 774–777, Fig. 2. doi:10.1126/science.aat1450
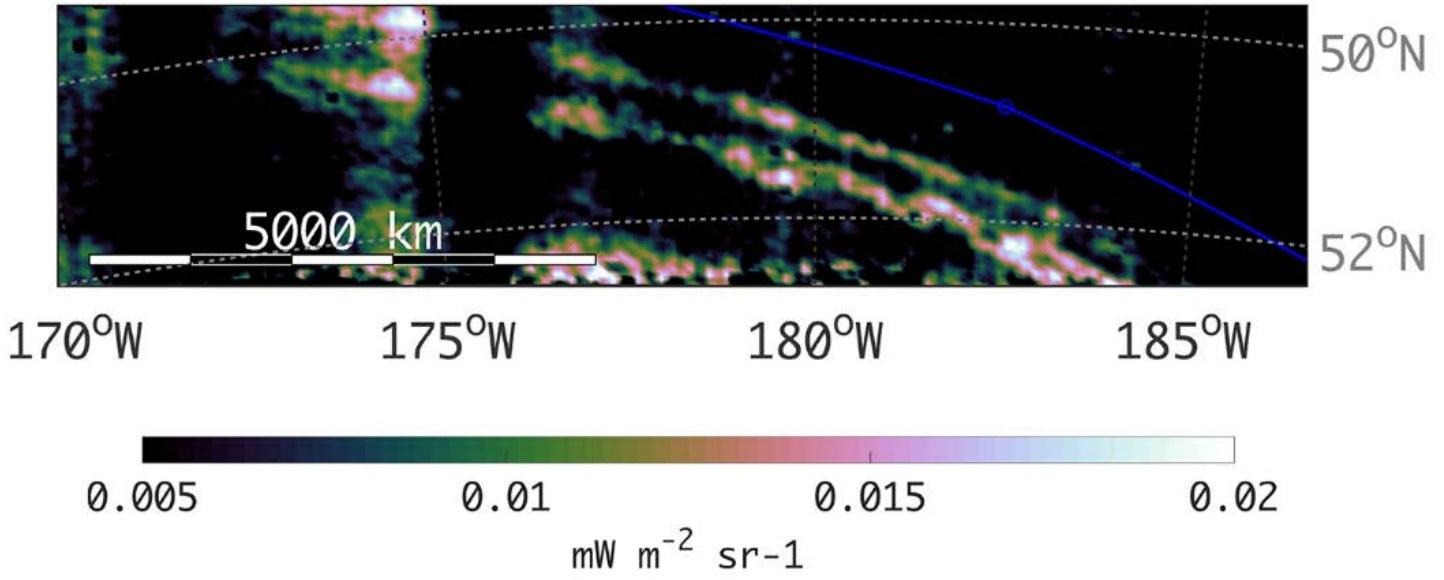
Figure 5. The tail of Io's footprint observed about 100° behind the main spot (27 August 2016). The tail splits into two separate arcs.
Source: Mura, A. et al. (2018), Science 361, 774–777, Fig. 3. doi:10.1126/science.aat1450
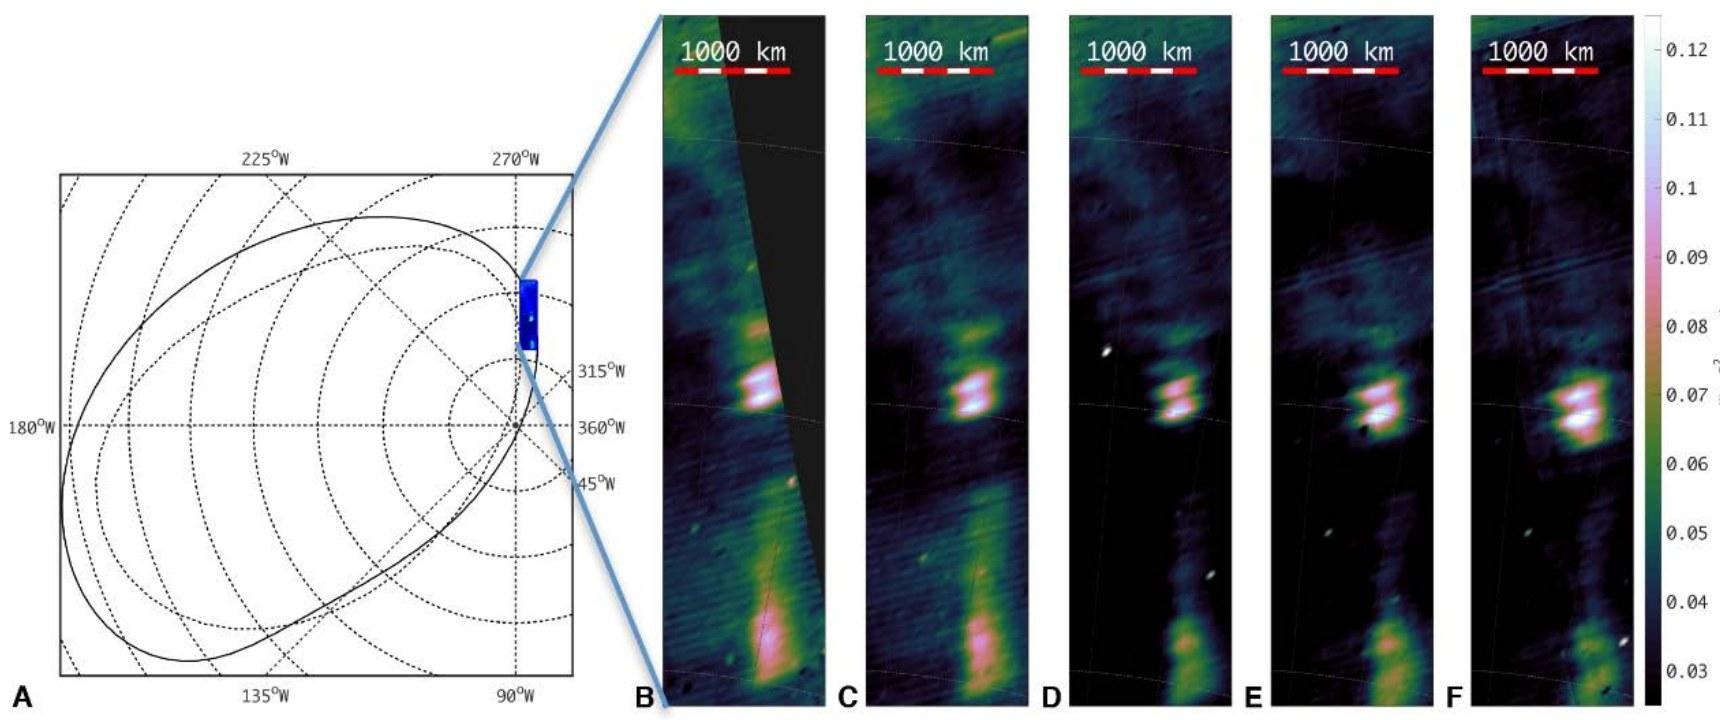
Figure 6. Five consecutive JIRAM images of Ganymede's footprint in the northern hemisphere (11 July 2017). The main spot is preceded by a fainter one.
Source: Mura, A. et al. (2018), Science 361, 774–777, Fig. 4. doi:10.1126/science.aat1450
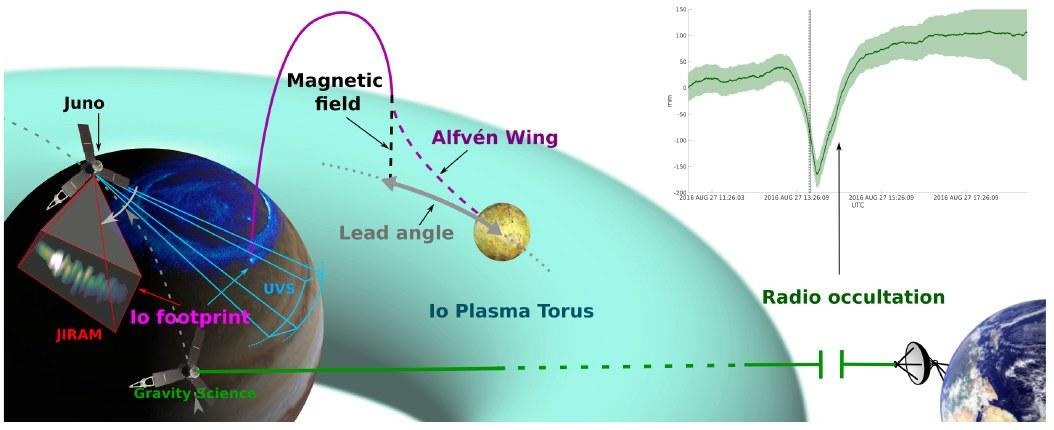
Figure 7. Diagram of how Juno monitors the Io plasma torus. JIRAM (and UVS) measure the position of Io's footprint, while radio occultation measures the torus's electron content.
Source: Moirano, A. et al. (2025), A&A 699, A53, Fig. 1. doi:10.1051/0004-6361/202453584
Jupiter's atmosphere: hot spots and ammonia clouds
Hot spots are nearly cloud-free regions through which infrared radiation escapes from the deepest layers of the atmosphere. During Juno's pass on 1 April 2018, JIRAM observed two hot spots on the boundary between the North Equatorial Belt and the Equatorial Zone from different angles. It thus measured how their brightness decreases towards the planet's limb. Comparison with models indicates that the cloud particles, about 1 µm in size, are not made of ammonium hydrosulfide alone. Explaining the data also requires a material containing carbon–nitrogen bonds, similar to tholins.
Reference: Grassi, D. et al. (2024), MNRAS 533, 2185–2198. doi:10.1093/mnras/stae1858
Models predict a layer of ammonia ice clouds, but these clouds are rarely observed. In data from Juno's first pass, JIRAM detected them inside a white vortex near 40° north latitude. The vortex is the result of a convective storm that lifted fresh ammonia from deep layers. This confirms that on Jupiter pure ammonia clouds are rare and linked to episodes of strong convection.
Reference: Biagiotti, F. et al. (2025), MNRAS 538, 1535–1564. doi:10.1093/mnras/staf381
Io, the most volcanic world in the Solar System
JIRAM produced thermal maps of Io and found new active volcanoes, including one near the south pole, in regions that had never been mapped. In its spectra it identified sulfur dioxide (SO₂). In images of the same region taken two months apart, it saw the intensity of hot spots change, probably because of new lava flows.
During the May 2023 flyby, JIRAM observed "hot rings" along the edges of at least ten paterae, Io's large volcanic depressions. The rings indicate that active lava lakes are common on the moon.
The close flybys of 2022–2024 revealed Loki Patera, Io's largest lava lake, in detail down to 400 m per pixel. The images show "resurfacing" waves crossing the lake. They also show small islands that have stayed in the same place since Voyager 1, for at least 45 years.
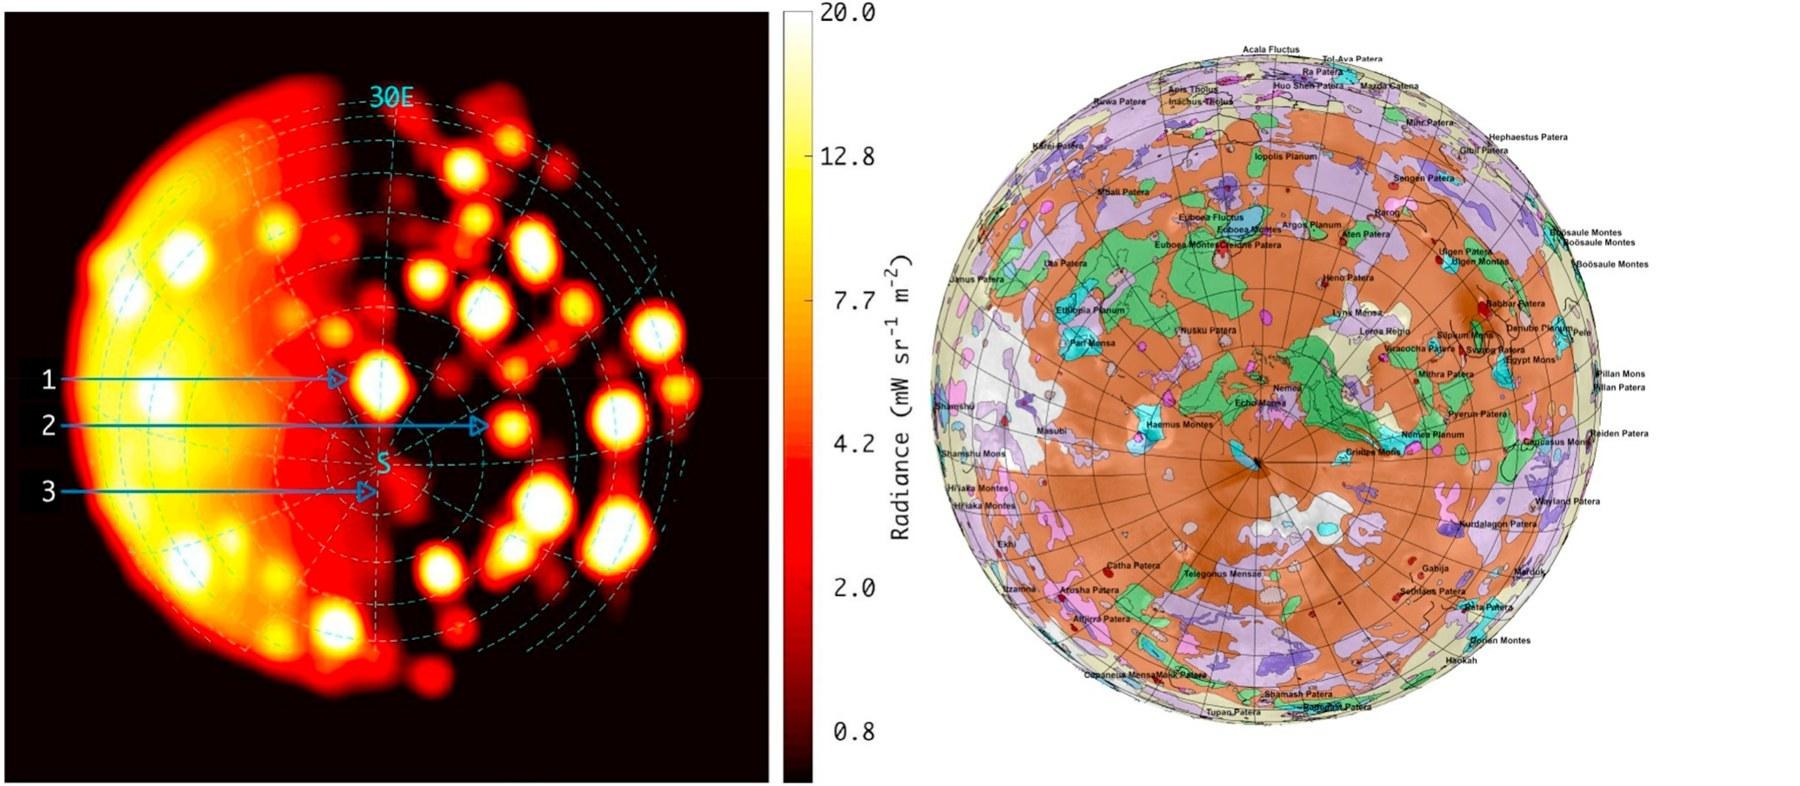
Figure 8. Left: stacked JIRAM M-band images (orbit 10) of Io's southern hemisphere. The arrows mark hot spots, including some not previously observed, one of them near the south pole. Right: Io's geological map seen from the same vantage point.
Source: Mura, A. et al. (2020), Icarus 341, 113607, Fig. 4. doi:10.1016/j.icarus.2019.113607
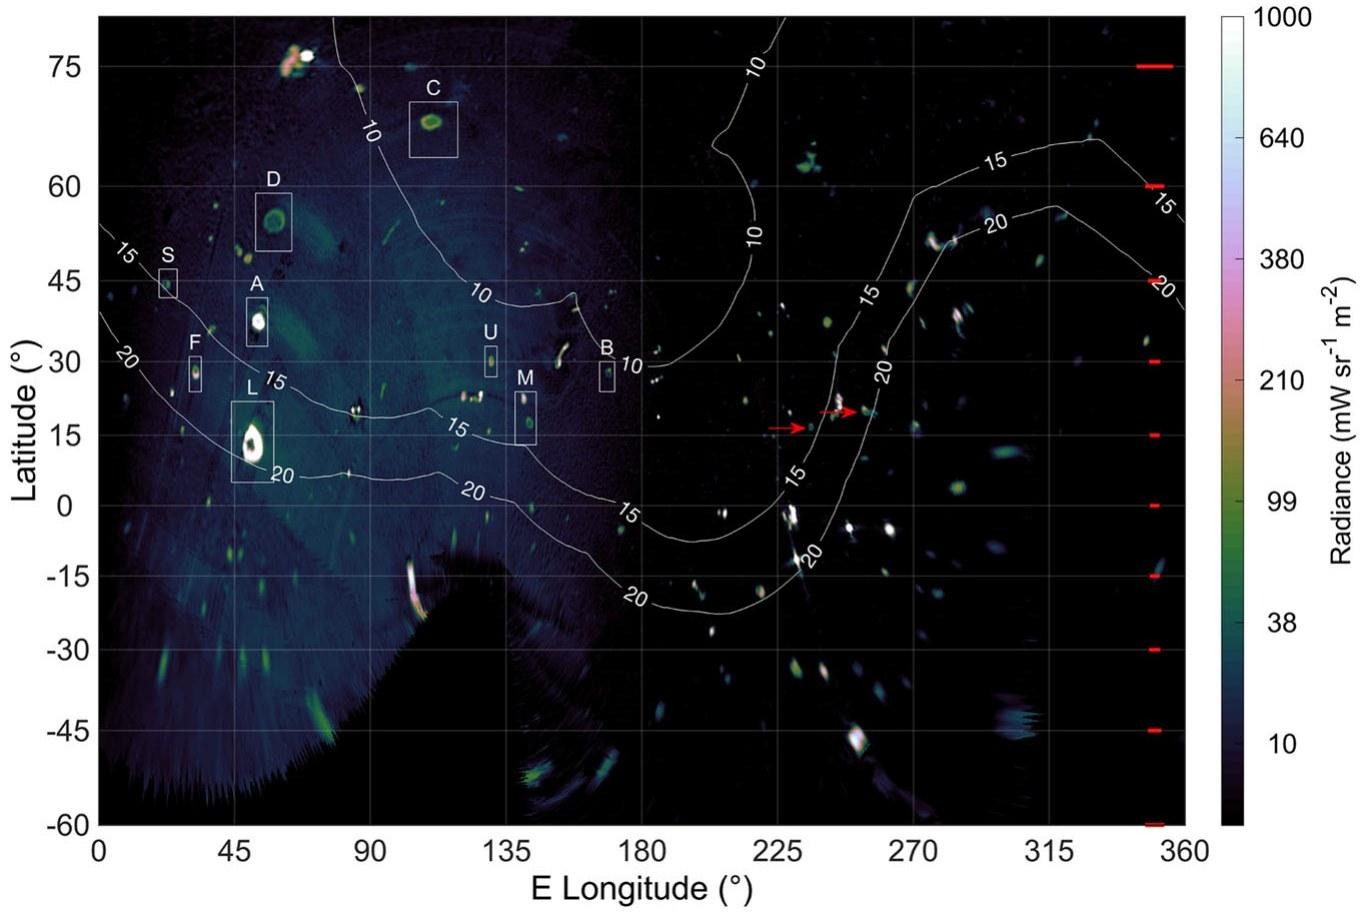
Figure 9. Mosaic of Io's M-band radiance from the May 2023 flyby, at resolutions down to 9 km/pixel. The boxes mark the paterae with hot rings.
Source: Mura, A. et al. (2024), Communications Earth & Environment 5, 340, Fig. 1. doi:10.1038/s43247-024-01486-5
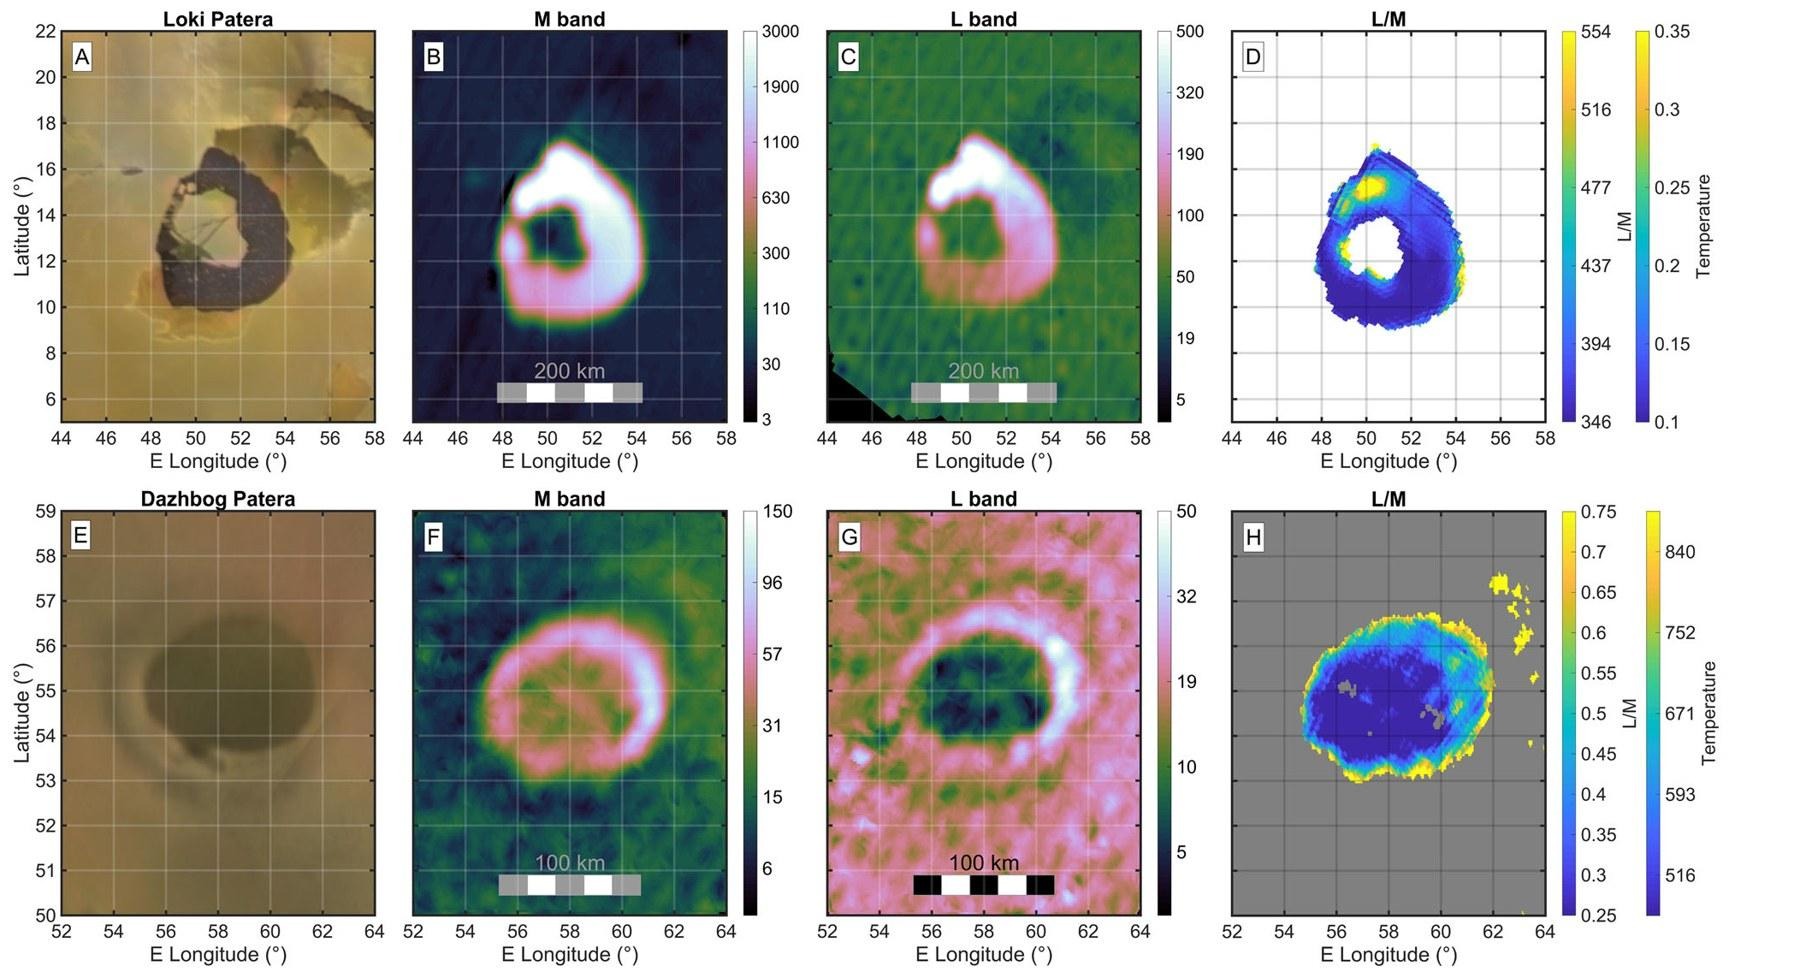
Figure 10. Loki Patera (top) and Dazhbog Patera (bottom). Each row shows the visible image, the M-band and L-band radiance and the temperature map. The "hot ring" is visible along the edge of the lava lake.
Source: Mura, A. et al. (2024), Communications Earth & Environment 5, 340, Fig. 2. doi:10.1038/s43247-024-01486-5
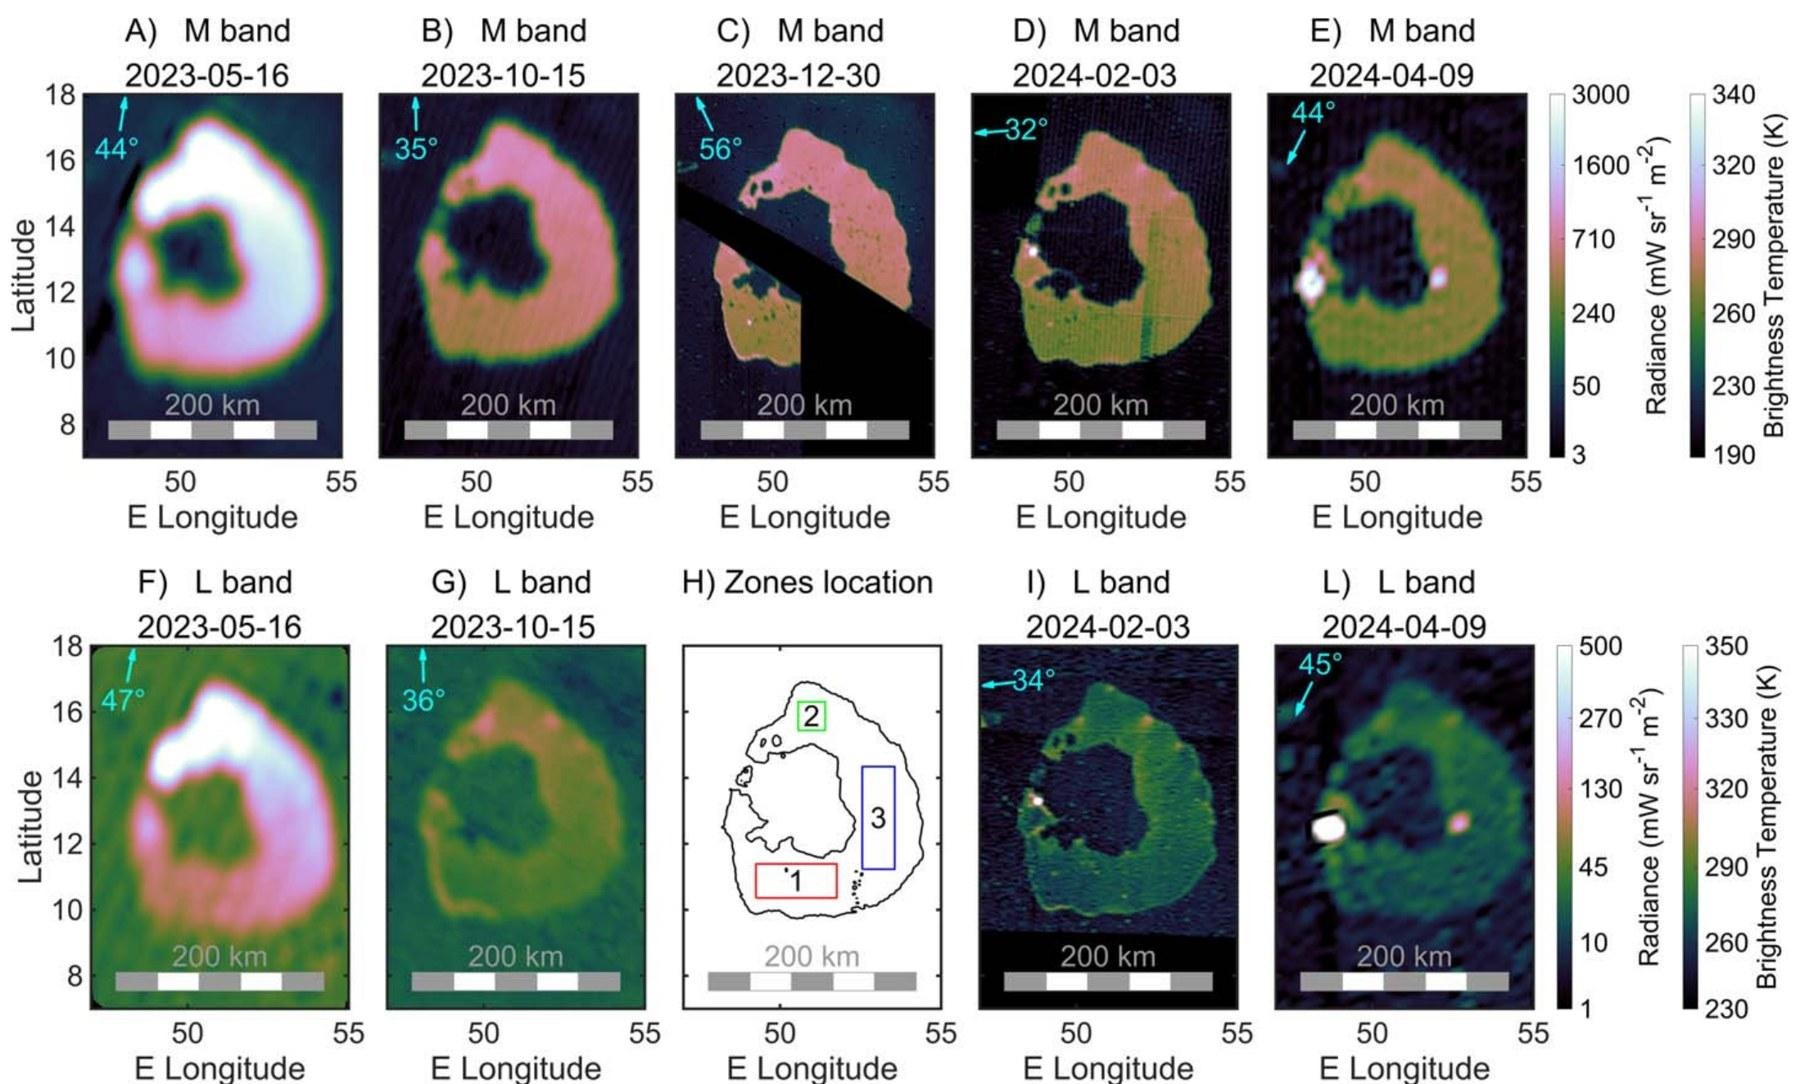
Figure 11. M-band and L-band radiance maps of Loki Patera from May 2023 to April 2024, showing how the lava lake surface cools over time.
Source: Mura, A. et al. (2025), The Planetary Science Journal 6, 43, Fig. 1. doi:10.3847/PSJ/ada27c
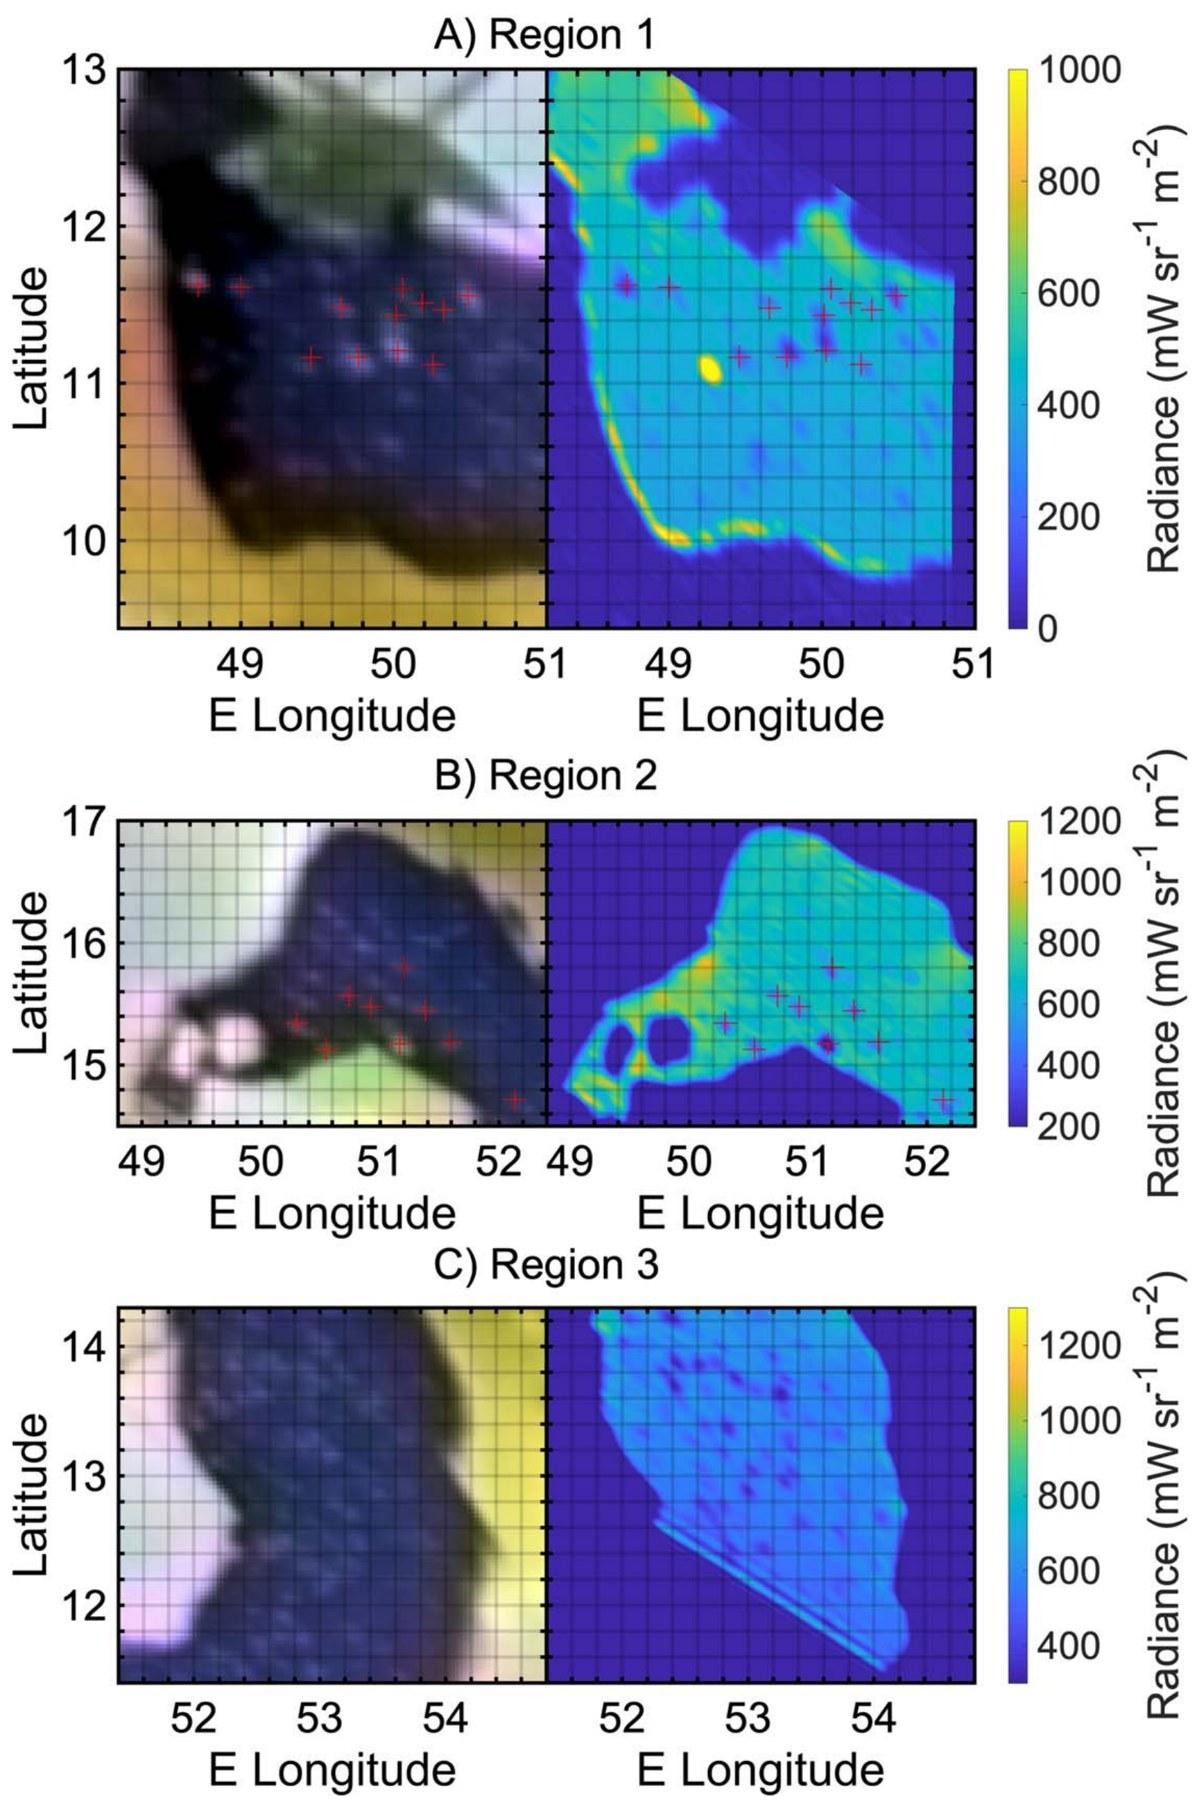
Figure 12. Close-ups of three regions of Loki Patera in visible light and in the infrared (M band). The red crosses mark the small islands, which have stayed in the same place for at least 45 years.
Source: Mura, A. et al. (2025), The Planetary Science Journal 6, 43, Fig. 4. doi:10.3847/PSJ/ada27c
Ganymede, the largest moon in the Solar System
On 26 December 2019, Juno passed relatively close to Ganymede. JIRAM observed its northern polar regions, previously poorly mapped, at resolutions down to 23 km per pixel. The data show that water ice is more abundant above 45° latitude, consistent with the effect of charged particles bombarding the surface (sputtering). JIRAM also identified hydrated salts, CO₂ and other minor species.
During the close flyby of 7 June 2021, JIRAM observed Ganymede at a resolution better than 1 km per pixel. The spectra revealed hydrated sodium chloride, ammonium chloride, sodium and ammonium carbonates, and organic compounds. Their composition and distribution indicate that they come from inside the moon. They would be brought to the surface by brines, salty water from the subsurface, whose chemistry reflects the water–rock interaction inside Ganymede.
Reference: Tosi, F. et al. (2024), Nature Astronomy 8, 82–93. doi:10.1038/s41550-023-02107-5
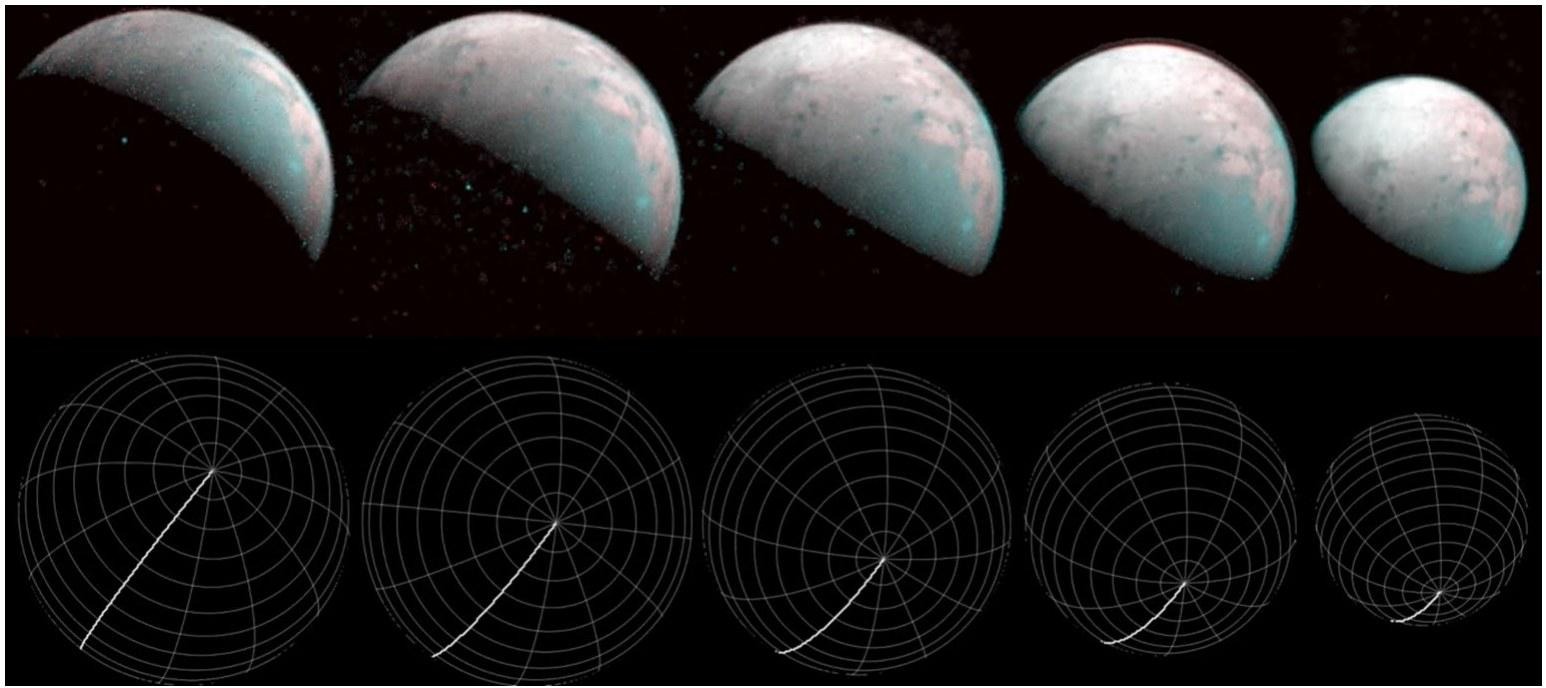
Figure 13. Five composite RGB images of Ganymede (JIRAM L and M bands) from the 26 December 2019 flyby (PJ24), with the viewing geometry.
Source: Mura, A. et al. (2020), J. Geophys. Res. Planets 125, e2020JE006508, Fig. 1. doi:10.1029/2020JE006508
References
Adriani, A. et al. (2018). Clusters of cyclones encircling Jupiter's poles. Nature, 555, 216–219. https://doi.org/10.1038/nature25491
Mura, A. et al. (2021). Oscillations and Stability of the Jupiter Polar Cyclones. Geophysical Research Letters, 48, e2021GL094235. https://doi.org/10.1029/2021GL094235
Mura, A. et al. (2018). Juno observations of spot structures and a split tail in Io-induced aurorae on Jupiter. Science, 361, 774–777. https://doi.org/10.1126/science.aat1450
Moirano, A. et al. (2021). Morphology of the Auroral Tail of Io, Europa, and Ganymede From JIRAM L-Band Imager. Journal of Geophysical Research: Space Physics, 126. https://doi.org/10.1029/2021JA029450
Moirano, A. et al. (2023). Variability of the Auroral Footprint of Io Detected by Juno-JIRAM and Modeling of the Io Plasma Torus. Journal of Geophysical Research: Space Physics, 128. https://doi.org/10.1029/2023JA031288
Moirano, A. et al. (2025). The Io plasma torus observed by Juno between 2016 and 2022. Astronomy & Astrophysics, 699, A53. https://doi.org/10.1051/0004-6361/202453584
Migliorini, A. et al. (2019). H3+ characteristics in the Jupiter atmosphere as observed at limb with Juno/JIRAM. Icarus, 329, 132–139. https://doi.org/10.1016/j.icarus.2019.04.003
Grassi, D. et al. (2024). Jupiter's Hotspots as observed by JIRAM-Juno: limb darkening in thermal infrared. Monthly Notices of the Royal Astronomical Society, 533, 2185–2198. https://doi.org/10.1093/mnras/stae1858
Biagiotti, F. et al. (2025). Evidence of pure ammonia clouds in Jupiter's Northern Temperate domain from Juno/JIRAM infrared spectral data. Monthly Notices of the Royal Astronomical Society, 538, 1535–1564. https://doi.org/10.1093/mnras/staf381
Mura, A. et al. (2020). Infrared observations of Io from Juno. Icarus, 341, 113607. https://doi.org/10.1016/j.icarus.2019.113607
Mura, A. et al. (2024). Hot rings on Io observed by Juno/JIRAM. Communications Earth & Environment, 5, 340. https://doi.org/10.1038/s43247-024-01486-5
Mura, A. et al. (2025). Observations of Loki Patera by Juno during Close Flybys. The Planetary Science Journal, 6, 43. https://doi.org/10.3847/PSJ/ada27c
Mura, A. et al. (2020). Infrared Observations of Ganymede From the Jovian InfraRed Auroral Mapper on Juno. Journal of Geophysical Research: Planets, 125, e2020JE006508. https://doi.org/10.1029/2020JE006508
Tosi, F. et al. (2024). Salts and organics on Ganymede's surface observed by the JIRAM spectrometer onboard Juno. Nature Astronomy, 8, 82–93. https://doi.org/10.1038/s41550-023-02107-5